This overclocking showdown is part of our RX Vega 64 “Unleashed” series benchmarking the Liquid Cooled Edition (LC) vs. the GTX 1080 Founders Edition (FE). Today, we have optimized our overclocks with all performance options set to their highest limits to get the most performance from each card.
At stock, we found that the $699 liquid cooled edition of the RX Vega 64 trades blows in performance with the $549 stock-clocked reference GTX 1080 FE using 27 PC games but it failed to impress with 10 virtual reality (VR) games. This time, we will add Prey as our 28th PC game, and overclock the GTX 1080 FE and the RX Vega 64 liquid cooled edition each as far as they will go to see where they stand in relation to each other fully overclocked.
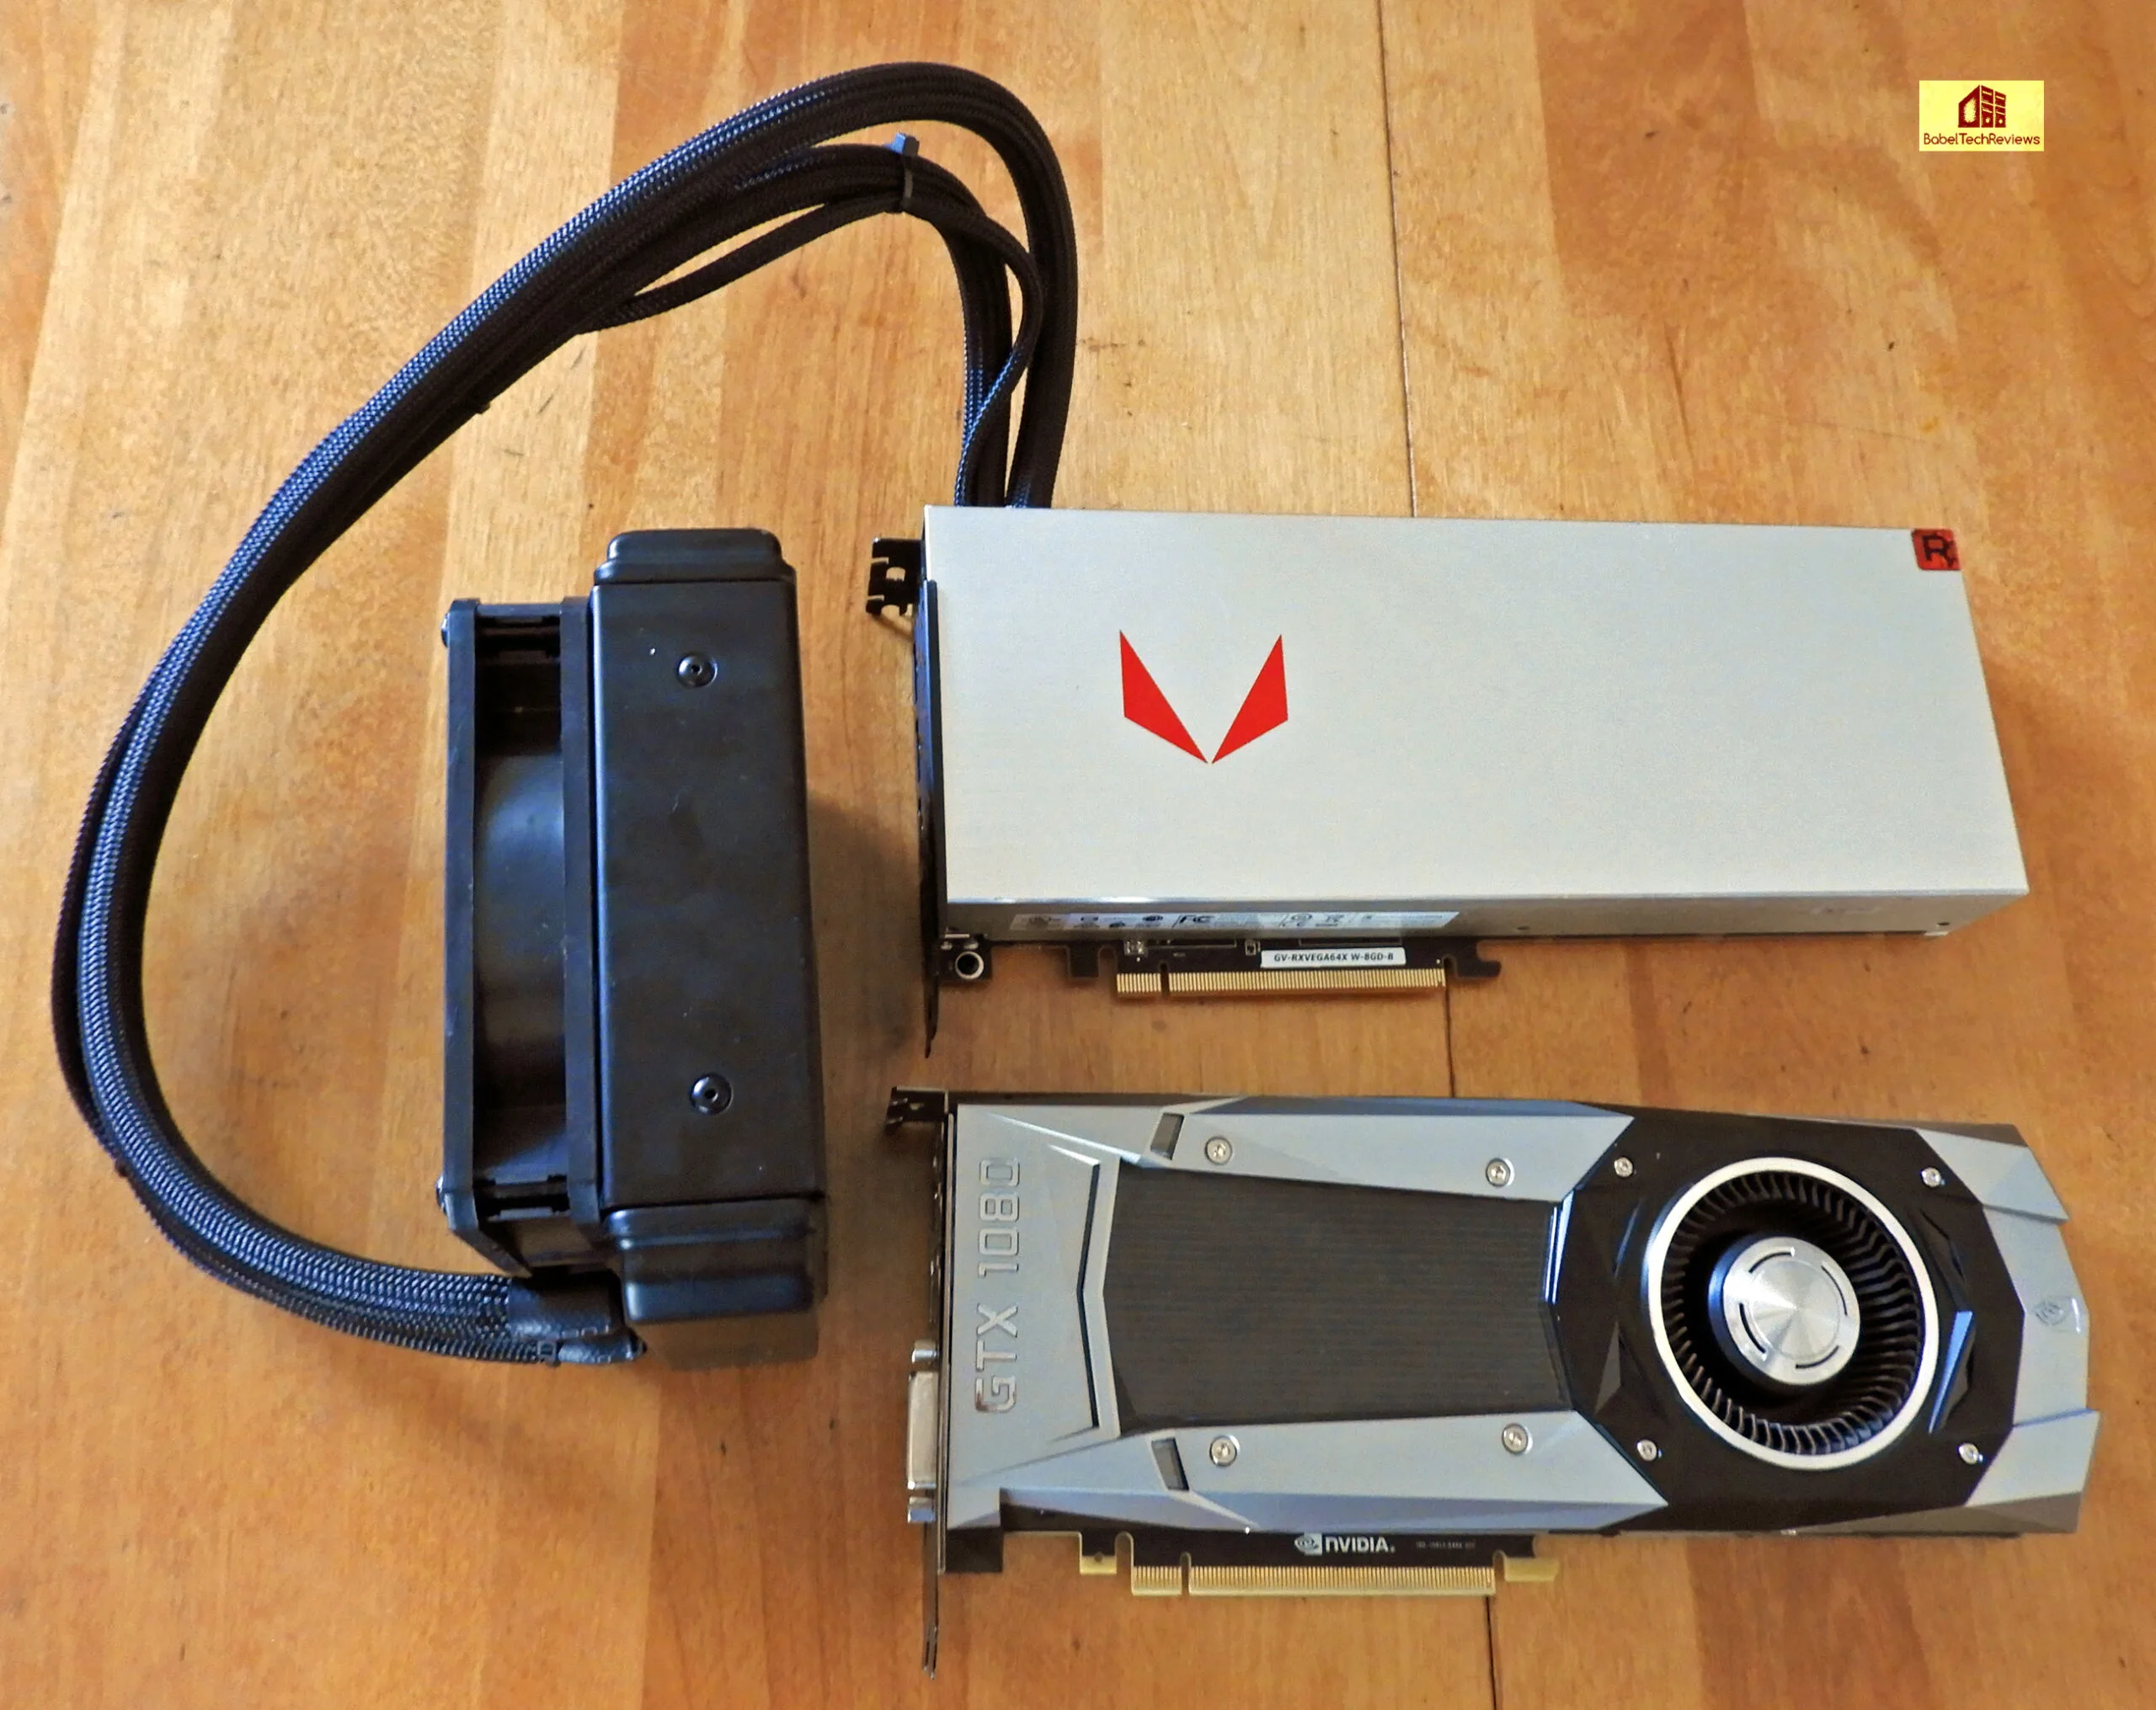
Overclocking the Gigabyte RX Vega 64 Liquid Cooled Edition
The $699 Gigabyte Liquid Cooled edition of the RX Vega 64 is no different than any other AMD Vega 64 liquid cooled edition, and it is probably impossible to find at this price outside of buying an AMD hardware bundle. Prey and Wolfenstein II: The New Colossus are usually bundled with this card if you can find one. The liquid cooled RX Vega 64 is clocked up over the reference version, and we saw our overall stock-clocked Boost average around 1678MHz. We found that as long as the ambient temperatures remain cool and the power and temperature limits are maximized, it will not throttle even with the stock fan profile.
After much testing, we settled on a 2.0% overclock to the core for an overall average 1716MHz boost, and with memory clocks overclocked from the reference 945MHz to 1080MHz with the radiator fan allowed to ramp to 100%. Temperatures never reached 70 C and even at 100%, the fan is not annoying, and at stock profile it is rather quiet.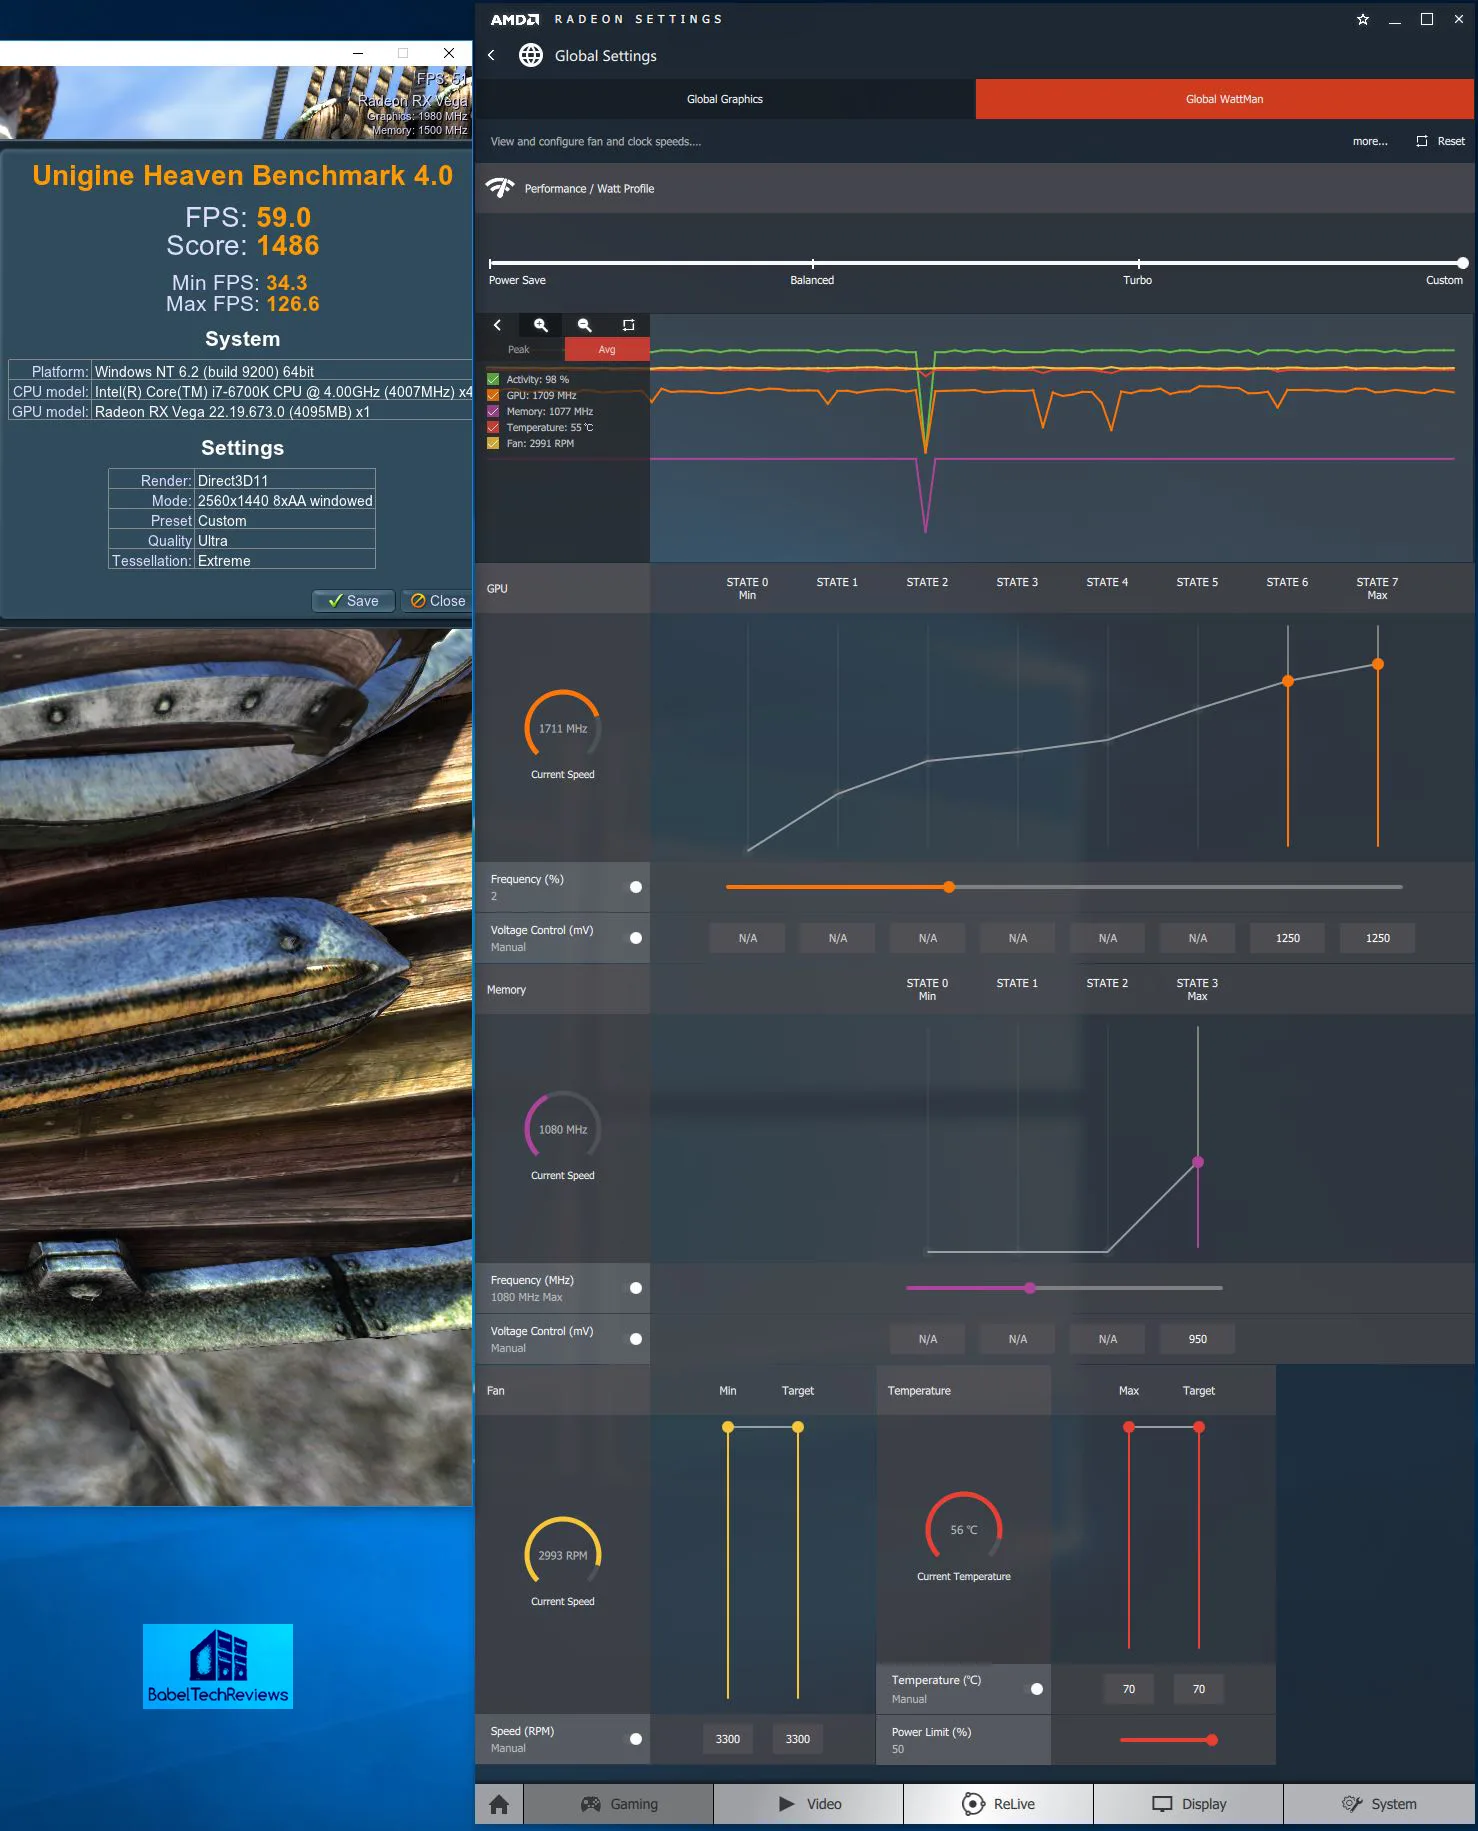 We found that higher Vega 64 memory clocks gained significant performance in games. However, it appears that the Gigabyte RX Vega 64 liquid cooled edition is already running very close to its maximum core clocks, and we needed WattMan’s maximum 1250mV for complete stability in all of our tested games with only a 2% maximum overclock.
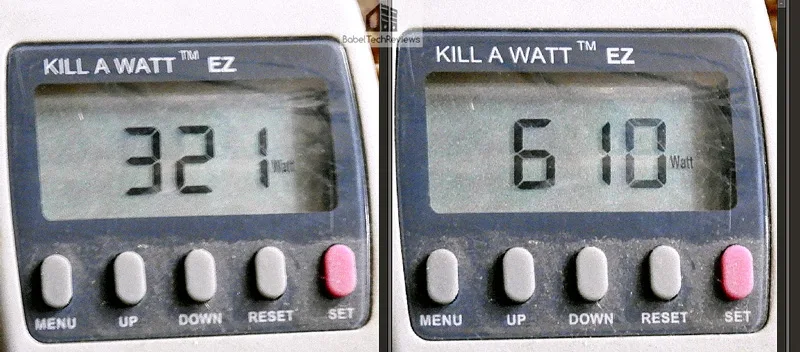
Unfortunately, the power draw goes through the roof when the RX Vega 64 LC is overclocked versus the overclocked GTX 1080 FE. Below we see the total system draw using the overclocked GTX 1080 FE running maxed-out Heaven 3.0 at 2560×1440 versus the overclocked RX Vega 64 LC on the right. You can run overclocked GTX 1080 SLI with about the same total system power draw as with a single overclocked RX Vega 64!
We tried undervolting but we did not have good results nor could we maintain any meaningful overclock with our sample of the liquid cooled RX Vega 64. We also noted that higher ambient temperatures caused instability and we needed to run our benchmarks in a room that was cooler than 78 F, unlike with the GTX 1080 where we tested with indoor temperatures peaking around 80 F during a recent Southern California heatwave.
Overclocking the Founders Edition of the GTX 1080
We devoted a separate evaluation to the GTX 1080 Founders Edition overclocking which you can read here. It currently is priced at $549 and it generally comes bundled with Destiny 2. Because of an intense heatwave which occurred during testing, we settled on a final stable overclock of +175 MHz to the core which settled in around or above 1935MHz with GPU Boost, and we added 375MHz to achieve a 5375MHz final stable memory clock.
We did not need to adjust the fan profile, but left it on automatic. The GTX 1080 memory overclock greatly contributed to the increased performance. The fan never became obtrusive as we were able to leave it at stock and the GPU remained relatively cool in the mid-70s C.
Testing Platform
Our testing platform is Windows 10 Home 64-bit, using an Intel Core i7-6700K at 4.00GHz which turbos to 4.6GHz for all cores as set in the ASRock Z170 motherboard’s BIOS, and 16GB of HyperX DDR4 at 3333MHz. The settings and hardware are identical except for the two cards being tested.
We also feature our newest 2017 games, Prey and DiRT 4, and we also include eight DX12 games, plus we also benchmark DOOM on the Vulkan API. We also test VR with Futuremark’s Orange and Blue Room benchmarks and will compare the performance of 28 modern games at 1920×1080, 2560×1440, 3440×1440, and at 3840×2160 resolutions with maximum settings.
Before we run benchmarks, let’s check out the test configuration.
Test Configuration – Hardware
- Intel Core i7-6700K (reference 4.0GHz, HyperThreading and Turbo boost is on to 4.6GHz; DX11 CPU graphics).
- ASRock Z170M OC Formula motherboard (Intel Z170 chipset, latest BIOS, PCIe 3.0/3.1 specification, CrossFire/SLI 8x+8x)
- HyperX 16GB DDR4 (2x8GB, dual channel at 3333MHz), supplied by HyperX/Kingston
- Gigabyte RX Vega 64 Liquid Cooled Edition, stock clocks (1750Mhz/945MHz) and overclocked
- GTX 1080 8GB, Founders Edition, reference clocks and overclocked, supplied by NVIDIA
- GTX 1080 Ti 11GB, Founders Edition, reference clocks, supplied by NVIDIA
- Two 2TB Seagate 7200 rpm SSHDs for each platform
- EVGA 1000G 1000W power supply unit (for both platforms)
- EVGA CLC280, 280mm CPU watercooler, supplied by EVGA
- Onboard Realtek Audio
- Genius SP-D150 speakers, supplied by Genius
- Thermaltake Overseer RX-I full tower case, supplied by Thermaltake
- ASUS 12X Blu-ray writer
- Monoprice Crystal Pro 4K
- ACER Predator X34 GSYNC display, supplied by ACER/NVIDIA
Test Configuration – Software
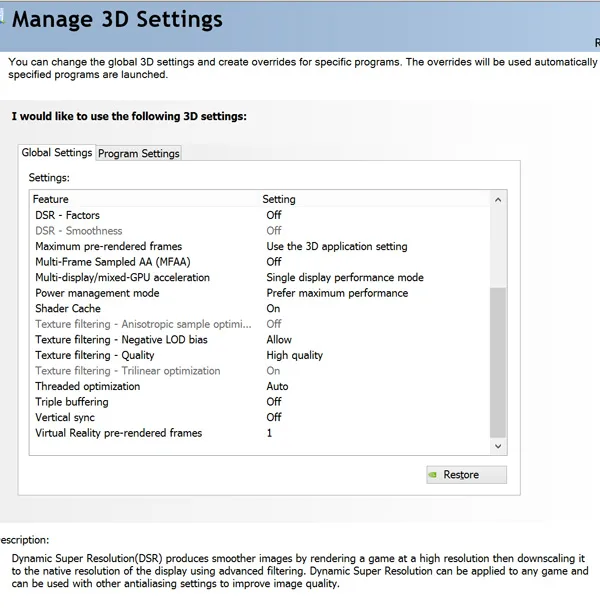
- GeForce WHQL 384.94 was used for the GTX 1080 at stock and WHQL 385.41 for overclocked settings. WHQL 385.28 was used for the GTX 1080 Ti. High Quality, prefer maximum performance, single display. See control panel images below.
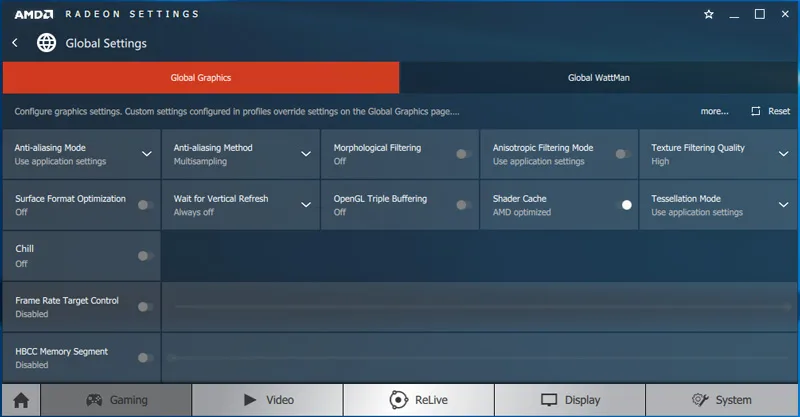
- AMD ReLive Software RX Vega public launch drivers (17.30.1051-b6) were used for the benching the Vega 64 at stock clocks and 17.8.2 was used for the overclocked results. See control panel image below.
- VSync is off in the control panel.
- AA enabled as noted in games; all in-game settings are specified with 16xAF always applied
- All results show average frame rates including minimum frame rates shown in italics on the chart next to the averages in smaller font. Percentage increases are calculated between the average frame rates of the RX Vega 64 at stock and at overclocked settings, and also of the GTX 1080 between stock and overclocked settings.
- Highest quality sound (stereo) used in all games.
- Windows 10 64-bit Home edition, all DX11 titles were run under DX11 render paths. Our four DX12 titles are run under the DX12 render path. Latest DirectX
- All games are patched to their latest versions at time of publication.
- WattMan
- MSI Afterburner.
- OCAT
- Fraps
The 28 PC Game benchmark suite & 4 synthetic tests
Synthetic
- Firestrike – Ultra & Extreme
- Time Spy DX12
- VRMark Orange Room
- VRMark Blue Room
DX11 Games
- Crysis 3
- Metro: Last Light Redux (2014)
- Grand Theft Auto V
- The Witcher 3
- Fallout 4
- Assassin’s Creed Syndicate
- Just Cause 3
- Rainbow Si Siege
- DiRT Rally
- Far Cry Primal
- Call of Duty Infinite Warfare
- Battlefield 1
- Watch Dogs 2
- Resident Evil 7
- For Honor
- Ghost Recon Wildlands
- Mass Effect: Andromeda
- Prey
- DiRT 4
DX12 Games
- Tom Clancy’s The Division
- Ashes of the Singularity
- Hitman
- Rise of the Tomb Raider
- Total War: Warhammer
- Deus Ex Mankind Divided
- Gears of War 4
- Sniper Elite 4
Vulkan Game
- DOOM
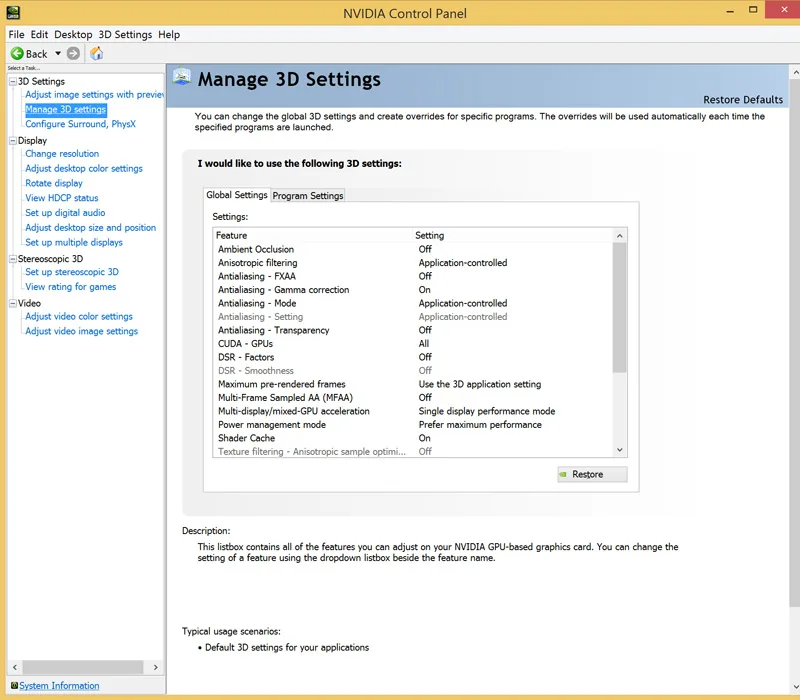
Nvidia Control Panel settings
We used MSI’s Afterburner to set the power and temp limits to their maximums.
AMD Radeon Global Settings:
Here are the global game settings in AMD’s ReLive control panel that we use. We used WattMan to set the Power and temp limits to their maximums.
Using WattMan for our regular non-overclocked settings, the Power Limit is set to +50%, the temperature is allowed to reach the maximum 70C, and the fan is also allowed to spin up to its maximum, but the core and memory clocks are unchanged.
Even with the latest Crimson 17.8.2 drivers, WattMan does not always hold its settings between reboots, so it’s important to check and reset your overclock as needed.
Calculating Percentages
There are two methods of calculating percentages. In our last evaluation we used “Performance Differences” to compare the GTX 1080 and the GTX 1080 Ti versus the RX Vega 64 LC. This time we are now using “Percentage Changes” which are usually used to show improvements in average frame rates (FPS) between stock and overclocked results.
For the percentage changes, we mean the increase in frame rates between the stock and the overclocked RX Vega 64 (and stock and overclocked GTX 1080), divided by the absolute value of the original stock frame rate in FPS, multiplied by 100. Percentage change may be expressed by the algebraic formula where “V” is Value: ( ΔV / |V1| ) * 100 = ((V2 – V1) / |V1|) * 100
Let’s head to the performance charts to see how the overclocked-to-the-max GTX 1080 FE compares with the overclocked-to-the-max Gigabyte RX Vega 64 Liquid edition.
Performance summary charts
Below are the summary charts of 28 games and 4 synthetic tests. The highest settings are always chosen and DX12 is picked above DX11 where available. Specific game settings are listed on the charts and the benches were run at 1920×1080, 2560×1440, 3440×1440, and at 3840×2160. All results, except for the synthetic benchmarks show average frame rates and higher is always better. Minimum frame rates are shown when they are available, next to the averages but they are in italics and in a slightly smaller font.
The GTX 1080 stock results are presented in the first (dark green) performance results column next to the second (lighter green) GTX 1080 overclocked results; the overclocked RX Vega 64 LC results are in the first (lighter red) column, and the next (darker red) column represents the stock RX Vega 64 results. The first yellow column represents the percentage performance increases of the overclocked GTX 1080 over stock, and the last yellow column represents the performance percentage increase of the overclocked RX Vega 64 over its stock-clocked results. Finally the stock GTX 1080 Ti is shown in the last column for comparison. Yellow numbers show “wins” between the GTX 1080 and the RX Vega 64.
The following charts may be easier to read when opened in separate tabs or windows.
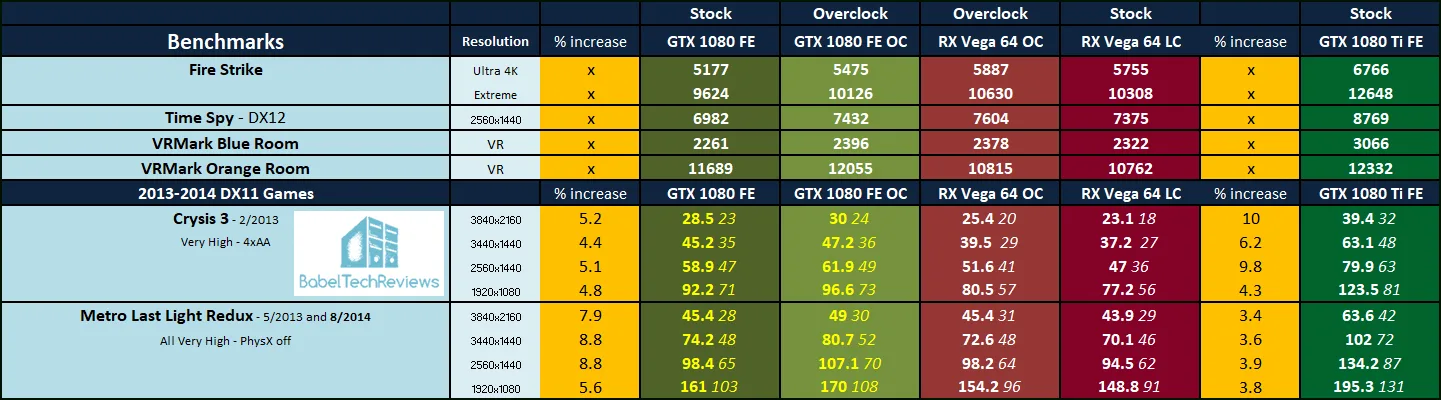
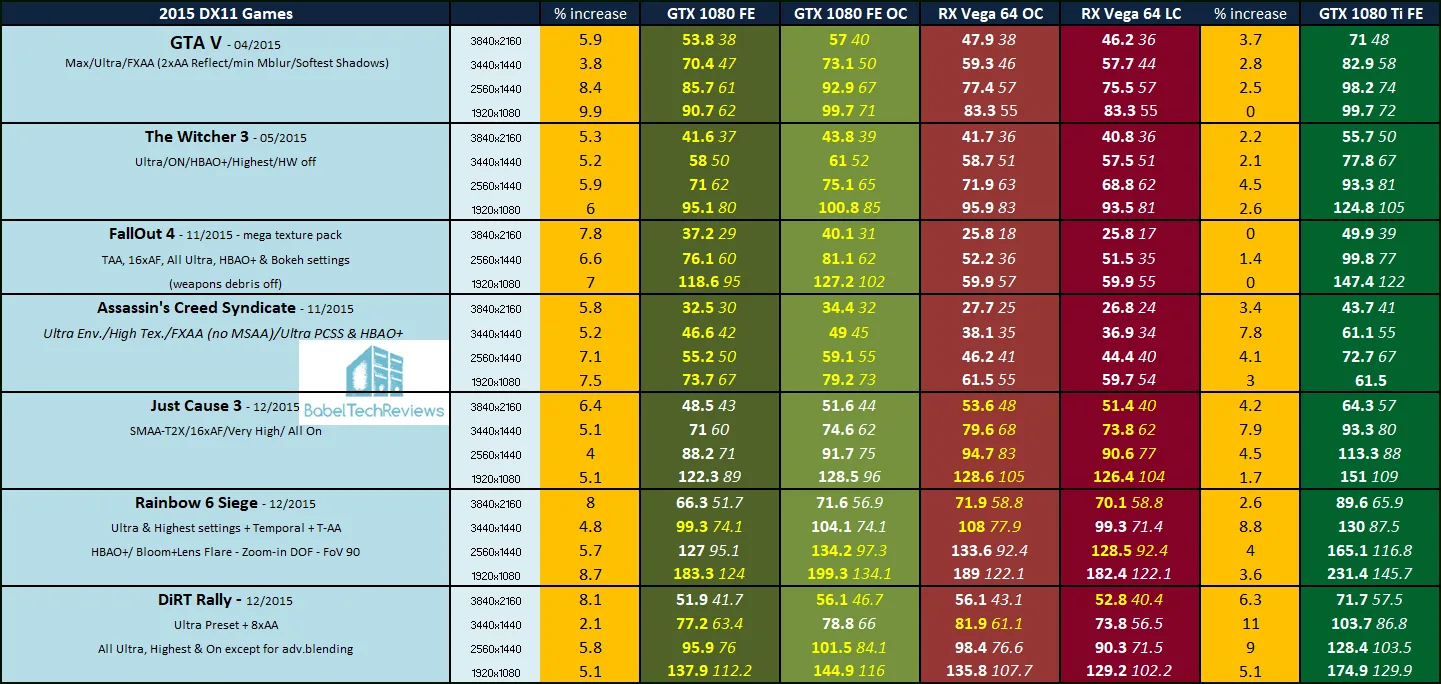

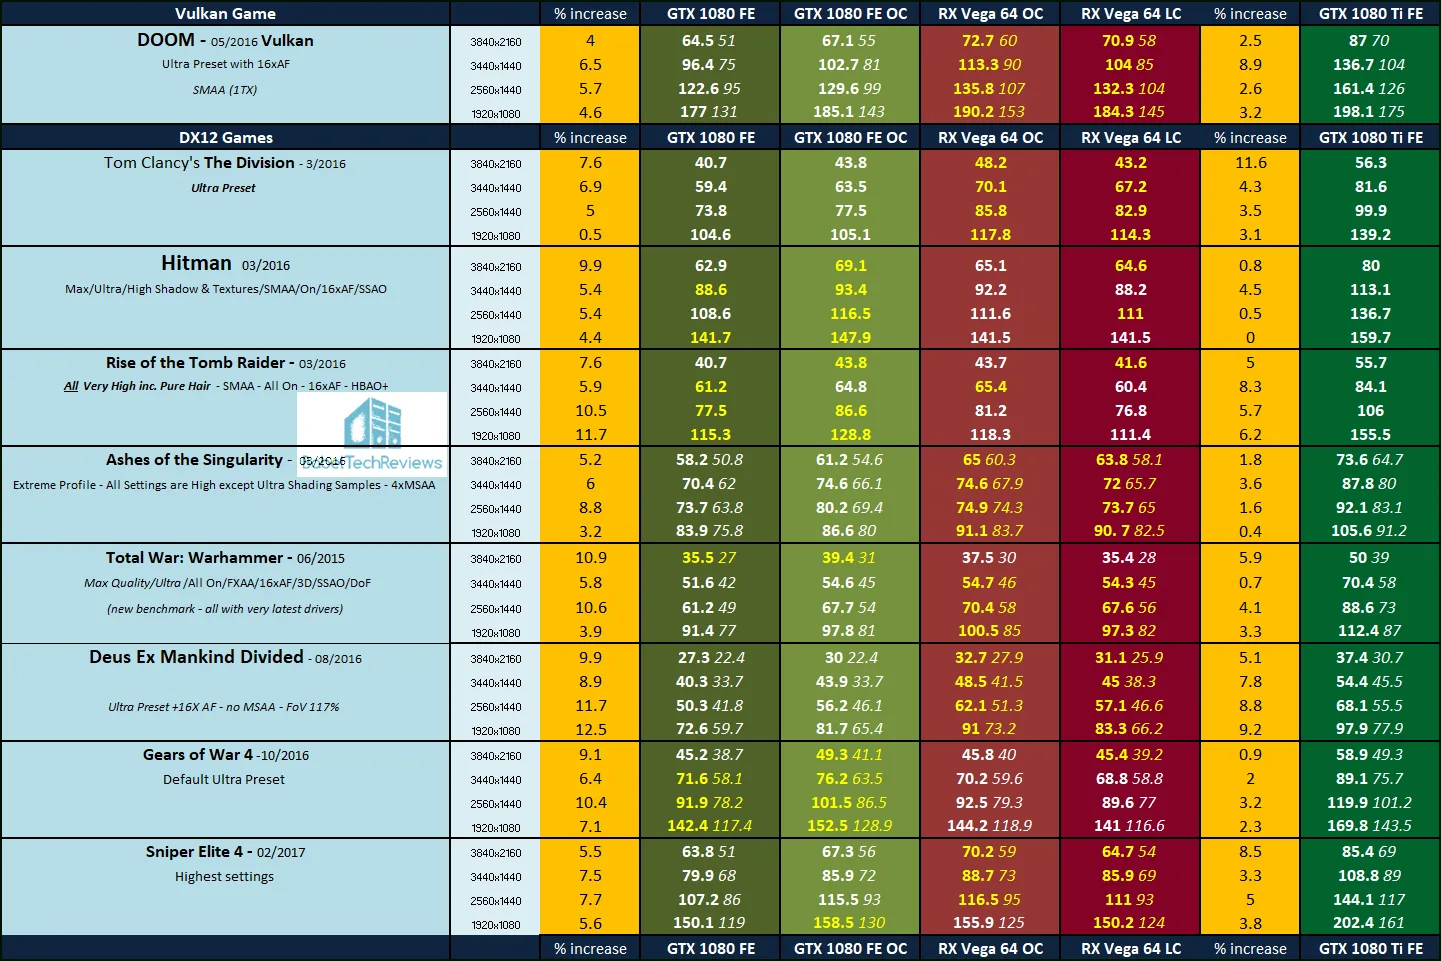 The $549 stock-clocked GTX 1080 FE wins 61 individual game benchmarks to the $699 RX Vega 64 Liquid edition’s 49 games. And even though both cards overclock decently, the overclocked RX Vega 64 only wins 41 game benchmarks with one tie, while losing to the overclocked GTX 1080 FE’s 68 wins and one tie.
The superior overclocking abilities of the GTX 1080 FE allow it to win in more games over the overclocked RX Vega 64 Liquid edition than it did at stock. And the GTX 1080 FE costs $150 less, and uses a lot less power.
Let’s head to our conclusion.
Conclusion
This has been quite an interesting exploration for us, evaluating the overclocked $699 Gigabyte RX Vega 64 liquid cooled edition versus the overclocked $549 GTX 1080 FE. Both cards overclock decently, with the RX Vega 64 gaining a very nice memory overclock which greatly increased its performance over stock. However, the GTX 1080 FE is a stronger overclocker, and it gained more performance overall from overclocking than its Vega 64 competitor did.
Both cards appear to scale well with overclocking although the GTX 1080 FE overclocks further and uses significantly less power doing so than the RX Vega 64 LC. At this point, using just performance as our primary metric, it becomes very difficult to recommend the RX Vega 64 over the GTX 1080 except perhaps in specific situations where the gamer already has a FreeSync display. However, the real star of AMD’s Vega constellation appears to be the RX Vega 56 if it can maintain its $399 pricing versus the GTX 1070.
Next up, we are benchmarking a reference RX Vega 56 which we will overclock against the GTX 1070 FE in preparation for testing an aftermarket RX Vega 56 later this month. Stay tuned.
Happy Gaming!
Comments are closed.