The GTX 680 versus the HD 7970 was a classic confrontation that began in 2012 that we are now repeating 3 years later. Codenamed Tahiti, the then new AMD flagship Radeon HD 7970 was announced on December 22, 2011, and it launched the next month at $550 with disappointing drivers which only placed it originally about 20% faster than the Nvidia Fermi flagship, the GTX 580. However, the primary competitor to the HD 7970 became Nvidia’s GeForce GTX 680 which launched at $499 in March, 2012 as Kepler architecture, with a strong emphasis on performance per watt and efficiency.
The GTX 680 is a 2GB vRAM-equipped mid-sized GPU on a 256-bit wide bus compared with the larger and more expensive to produce HD 7970 which is equipped with 3GB of GDDR5 memory on a 384-bit bus. Although the HD 7970 has higher bandwidth and better specs on paper, the GTX 680 was originally judged faster overall than the HD 7970, mostly due to better DX11 optimized drivers. This is what we had to say in our conclusion of the GTX 680’s launch review on AlienBabelTech in April, 2012:
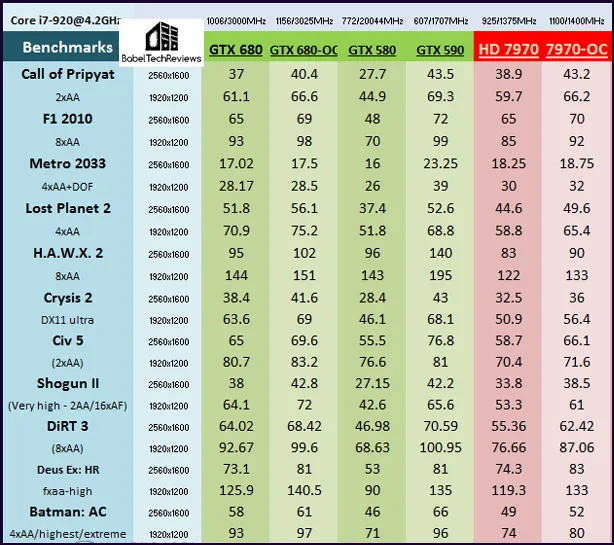
No matter how you add it up, the GTX 680 is generally faster overall than the HD 7970. Both overclock superbly so neither card has much of an advantage over the other with headroom on stock clocks and with the stock fan profile. As the resolution increases, the performance advantage of the GTX 680 diminishes a bit over the HD 7970 and the gap narrows. AMD would have to significantly increase the clocks of the HD 7970 to catch the GTX 680.
Here is our performance chart from this 2012 evaluation:
Just as we predicted shortly just before the HD 7970 launched, it turned out to be a short-lived SKU at 925MHz/1325MHz which was subsequently replaced by the AMD-overclocked HD 7970 GE (Gigahertz Edition – 1000MHz/1500MHz), and then respun the following generation into the nearly identical R9 280X with the same GE core speeds. In fact, our reference PowerColor HD 7970 and our VisionTek R9 280X will CrossFire with each other and will perform almost identically when set to the same clocks. Although the brand new R9 380X has nearly identical performance to the 280X/7970-GE, it is based on the similar but slightly more efficient Tonga architecture, not on Tahiti.
Our game benchmark suite has also changed from 2012. We have also added minimum frame rates in addition to averages, and we are now testing at resolutions up to 4K, with a strong emphasis on the very latest games. We want to see how these two formerly flagship GPUs stand now in relation to each other by playing the latest games with updated drivers at demanding settings that we usually bench at.
Over the past 2 years, Nvidia has reworked their Kepler architecture into the even more efficient Maxwell, and the 4GB vRAM-equipped GTX 970 has replaced the 2GB GTX 680 as a faster and more power-efficient GPU by Nvidia in their line-up. We want to test how well our original HD 7970 performs after also being degraded from AMD’s flagship, and after being replaced by the 290X, the 390X, and then by the Fury X in turn. We want to see how it can perform now against our same reference GTX 680 about 3 years after their respective launches.
It will be interesting to see which GPU was actually more “future proof”, and if the 2GB of vRAM that the GTX 680 is equipped with has any current disadvantage to the 3GB of vRAM the HD 7970 is equipped with. There has been a major console platform update in the meantime, and many new PC games require more vRAM than previously. So let’s compare today’s performance of the HD 7970 versus the GTX 680 after we look over our test configuration on the next page.
Test Configuration – Hardware
- Intel Core i7-4790K (reference 4.0GHz, HyperThreading and Turbo boost is on to 4.4GHz; DX11 CPU graphics), supplied by Intel.
- ASUS Z97-E motherboard (Intel Z97 chipset, latest BIOS, PCIe 3.0 specification, CrossFire/SLI 8x+8x)
- Kingston 16 GB HyperX Beast DDR3 RAM (2×8 GB, dual-channel at 2133MHz, supplied by Kingston)
- GeForce GTX 680, 2GB, Reference clocks, supplied by Nvidia
- PowerColor HD 7970, 3GB, Reference clocks
- GeForce GTX 980 Ti, 6GB reference clocks, supplied by Nvidia
- EVGA GTX 980 Ti SC, 6GB, at reference clocks in SLI, supplied by EVGA
- GeForce GTX 980, 4GB, reference clocks, supplied by Nvidia
- GALAX GTX 970 EXOC 4GB, GALAX factory clocks (1164MHz/7010MHz with 1430MHz boost on this sample), supplied by GALAX
- PowerColor R9 Fury X 4GB, stock clocks.
- VisionTek R9 290X 4GB at stock Uber clocks but with the fan allowed to spin up to 100% to prevent throttling.
- PowerColor R9 290X PCS+ ( overclocked reference design), at stock Uber clocks in CrossFire with the fan allowed to spin up to 100% to prevent throttling.
- VisionTek R9 280X, Reference clocks. Supplied by VisionTek
- Two 2TB Toshiba 7200 rpm HDDs; 1 for AMD and 1 for Nvidia, identically configured otherwise.
- EVGA 1000G 1000W power supply unit
- Cooler Master 2.0 Seidon, supplied by Cooler Master
- Onboard Realtek Audio
- Genius SP-D150 speakers, supplied by Genius
- Thermaltake Overseer RX-I full tower case, supplied by Thermaltake
- ASUS 12X Blu-ray writer
- Monoprice Crystal Pro 4K
Test Configuration – Software
- Nvidia GeForce 359.06 WHQL drivers for the GTX 970, GTX 980 and GTX 980 Ti, including for SLI (and GeForce 361.41 WHQL tested with the GTX 980, and for Assassin’s Creed Syndicate, Just Cause 3, Rainbow Six Siege, and DiRT Rally with all other GeForce single GPU cards). High Quality, prefer maximum performance, single display.
- AMD Crimson Software 15.12 for the HD 7970/280X and 15.11 for the other AMD cards (except for 290X CrossFire tested using 15.11; and also 15.12 for Assassin’s Creed Syndicate, Just Cause 3, Rainbow Six Siege, and DiRT Rally).
- VSync is off in the control panel.
- AA enabled as noted in games; all in-game settings are specified with 16xAF always applied
- All results show average frame rates except for the addition of minimum frame rates as noted on the charts.
- Highest quality sound (stereo) used in all games.
- Windows 10 64-bit Home edition, all DX11 titles were run under DX11 render paths. Our only DX12 title is run under the DX12 render path. Latest DirectX
- All games are patched to their latest versions at time of publication.
- EVGA’s PrecisionX, latest version.
The 25 Game benchmarks & 1 synthetic tests
- Synthetic
- Firestrike – Basic & Extreme
-
DX11* Games
- ARMA III
- Crysis 3
- Metro: Last Light Redux (2014)
- Thief
- Sniper Elite 3
- GRID: Autosport
- Middle Earth: Shadows of Mordor
- Alien Isolation
- Far Cry 4
- Dragon’s Age: Inquisition
- Dying Light
- Total War: Attila
- Wolfenstein: The Old Blood* (*OpenGL game)
- Grand Theft Auto V
- ProjectCARS
- the Witcher 3
- Batman: Arkham Origins
- Mad Max
- Fallout 4
- Star Wars: Battlefront
- Assassin’s Creed Syndicate
- Just Cause 3
- Rainbow Six Siege
- DiRT Rally
- DX12 Game
- Ashes of the Singularity – Alpha Demo benchmark
The Crimson drivers come with a new interface that may take users time to get used to. We feel the new interface is a big improvement over the older one, but there are still some issues – especially with changing resolutions and refresh rates that still need to be adjusted in Windows.
Here are the settings that we always use in AMD’s Crimson Control Center for our default benching. They are identical settings to what we used in the older Catalyst Control Center.
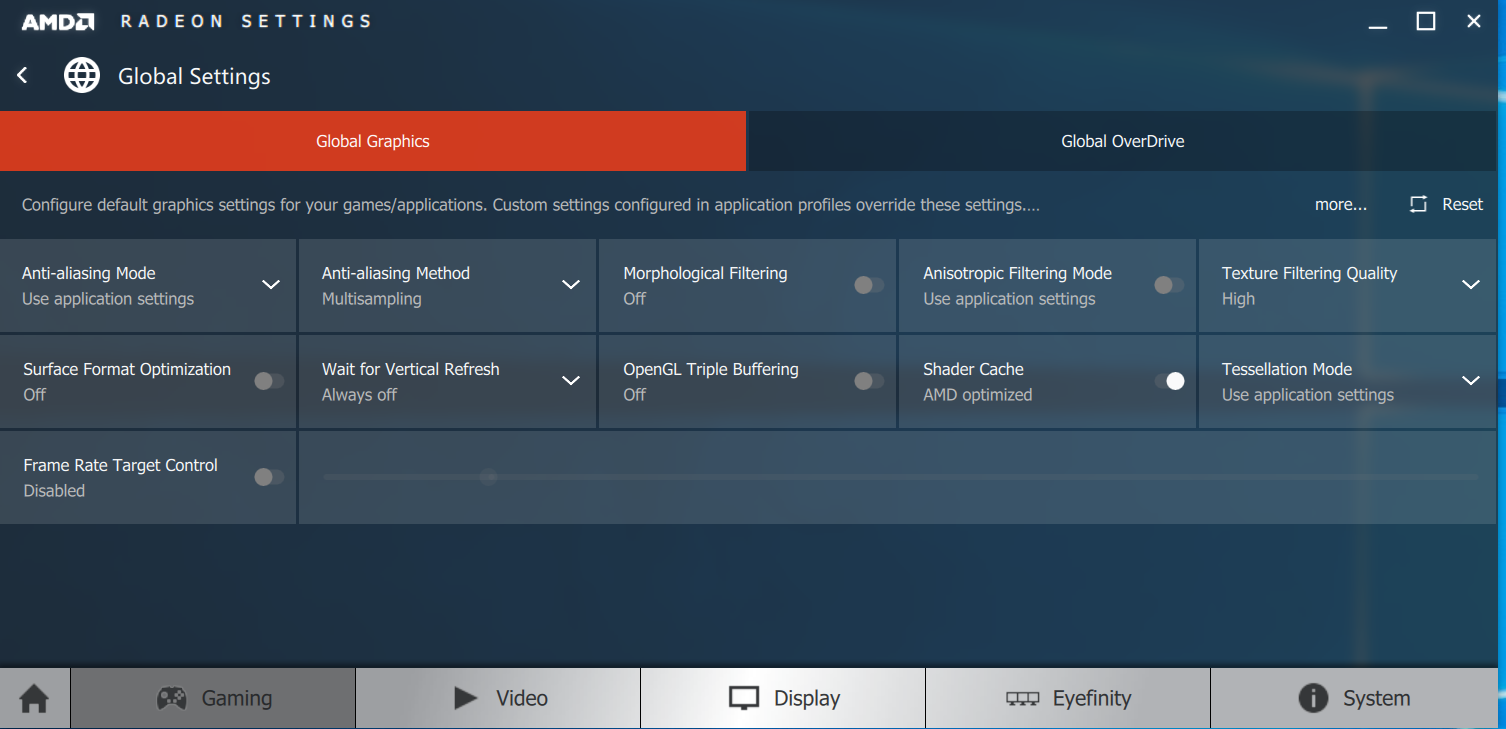
 Notice that we bench our 290X with the fan set to allow it to spin up to 100%. It never throttles under our benching conditions.
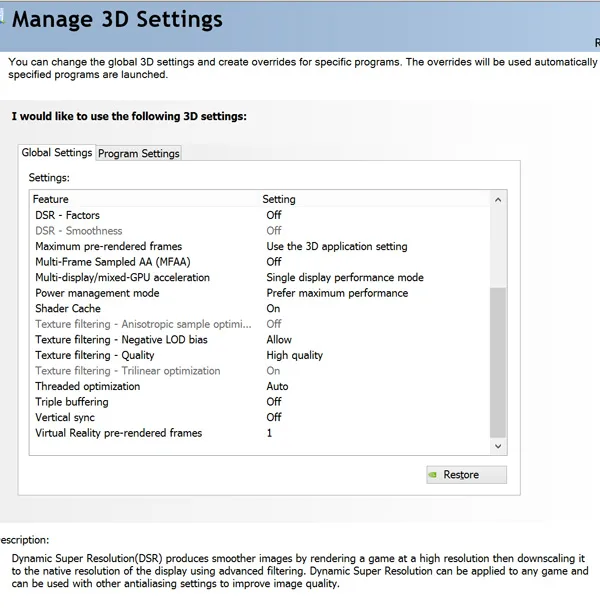
Here is Nvidia’s Control Panel and the settings that we run: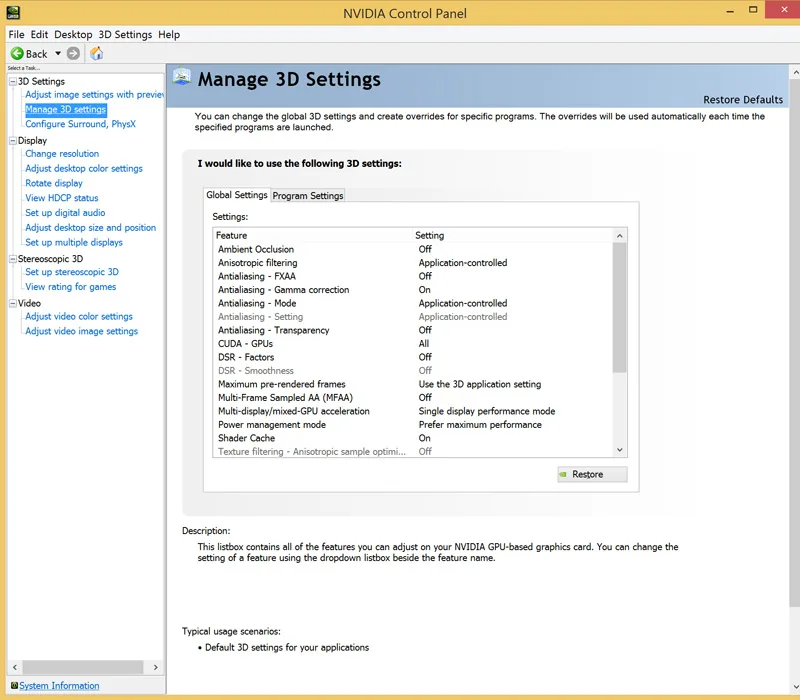
 Changes to BTR’s benching suite
Since 31 games take us too long to benchmark, we have recently dropped 6 games which include four of our oldest games, and also two of the games with a 60 fps engine cap as they are very difficult to benchmark properly. We no longer regularly bench Call of Pripyat, the Secret World, Hitman Absolution, BioShock Infinite, the Crew, and Metal Gear Solid V: The Phantom Pain, although we will occasionally bring them back for special evaluations together with other games that we have previously dropped.
We also recently dropped Heaven 4.0 from our benching suite as it is relatively old, and the Unigine engine is still not used in very many games. We plan to bench a minimum of 25 of the newest and especially demanding games regularly, and we will add new games as they are released.
Let’s head to the performance charts and graphs to see how the GTX 680 compares with HD 7970, how the GTX 970 compares with the 280X, and with the top cards of Winter, 2016 by benching today’s most demanding PC games.
The Performance summary charts
Here are the summary charts of 25 games and 1 synthetic test. The highest settings are always chosen and it is DX11 with the settings at ultra or maxed. Specific settings are listed on the main performance chart.
The benches are run at 1920×1080, 2560×1440, and 3840×2160. All results, except for Firestrike, show average framerates and higher is always better. For our two main competitors, we also show minimum frame rates where they make sense on the same line as the averages, but using slightly smaller regular unbolded italicized font to differentiate them. In-game settings are fully maxed out and they are identically high or ultra across all platforms. “NA” means the game would not run at all at the settings chosen, and “X” means the benchmark was not tested. An asterisk* means that there were issues with the benchmark, usually visuals.
The GTX 680/2GB vs. the HD 7970/3GB
The Main Chart shows the GTX 680 2GB at its reference clocks run directly against the HD 7970 at its reference clocks. The settings are identical.
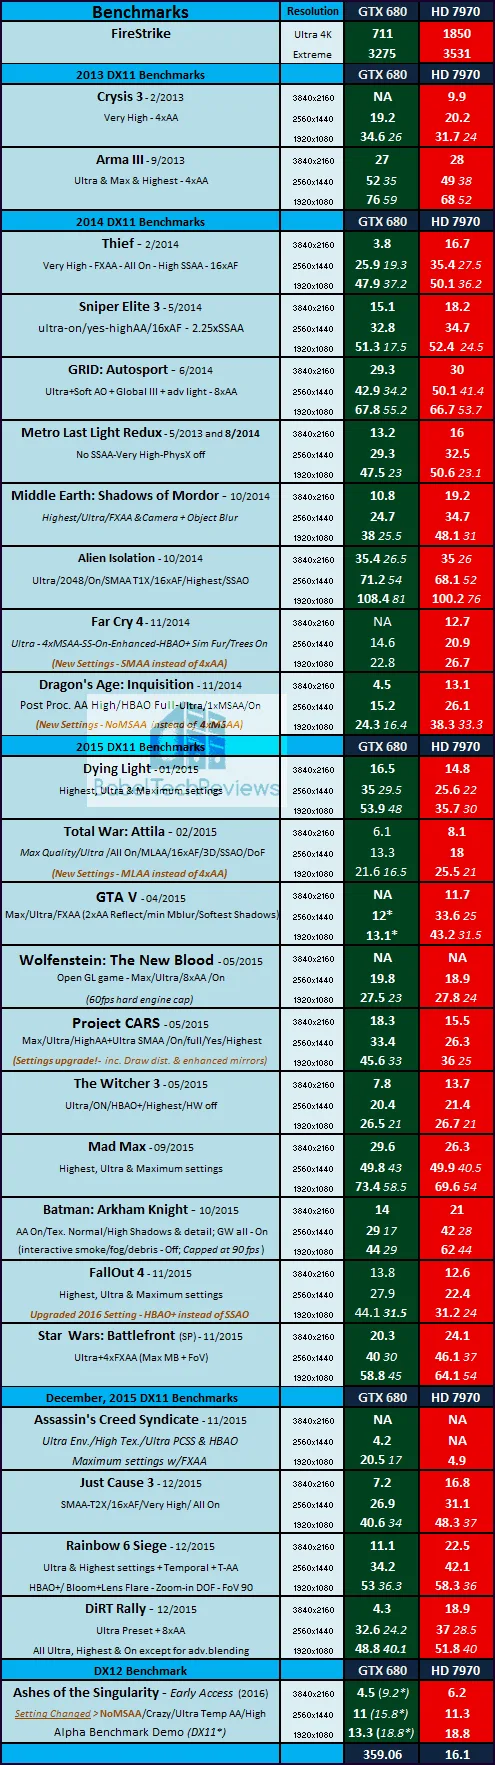
There is no doubt that the HD 7970 with its 3GB of vRAM, is a generally faster GPU for todays games than the 2GB vRAM-equipped GTX 680 although they are still competing in the same class. There are many games that ran poorly on the GTX 680 only because of the current 2GB vRAM limitation – which was non-existent in 2012/2013 – and that tweaking a few settings downward generally make the newest games run decently. Of course, if we replayed our original 2012 benchmark suite, the GTX 680 would still be generally faster than the HD 7970. And the HD 7970/280X/380X are also now solidly midrange and they are also mostly limited to 1920×1080 resolution.
Of course, the GTX 970 4GB card which was upgraded to Maxwell architecture nearly 2 years ago to replace the Kepler GTX 680 2GB, now competes with the R9 290X/R9 390, and it solidly beats the HD 7970/280X and by extension the R9 380X, as we can see from the Big Picture (below).
The summary chart: The Big Picture
This summary chart is what we call, “The Big Picture” since it places our two test cards into a much larger test bed. The drivers are noted at the bottom of the chart.

Let’s head for our conclusion.
The Conclusion
This was an interesting revisiting of a 2012 competition as suggested by one of BTR’s Community Forum members. We have seen that the HD 7970, although beaten generally by the GTX 680 for the first year or two of its existence, turned out to be generally more “future proof” for playing today’s latest modern PC games by virtue of having more vRAM.
Of course, the same benchmark suite that we used in 2012 would still favor the GTX 680, so it is clear that the latest generation of DX11 games are far more demanding on both video cards, but especially regarding vRAM usage. The GTX 680 is often limited by its 2GB of vRAM even at 1080P, and the frame rates will often improve dramatically by lowering a few settings. However, both cards are mostly now midrange and are really only suited only for 1920×1080 at reasonably high detail settings.
Stay tuned, there is a lot coming from us at BTR. Later this week we will perform a GeForce 361.75 WHQL Performance analysis featuring Rise of the Tomb Raider.
Happy Gaming!
Mark Poppin
BTR Editor-in-Chief
Comments are closed.